
Busbar Machine Capacity: Calculate Cycle Time, OEE, and Required Equipment
Machine speed is an input to capacity, not the answer. A punching unit may execute many strokes per minute while the cell loses time to loading, indexing, program selection, tool changes, bending, inspection and blocked downstream work. Capacity planning must count accepted finished parts through their actual route.
The method below produces a defendable parts-per-shift estimate and exposes which assumptions need to be verified in an RFQ or acceptance test.
Map the Product Mix by Process Route
Group products by a route that behaves similarly, not merely by customer or drawing number. One useful starting point is:
| Family | Typical route | Capacity driver |
|---|---|---|
| punched blanks | load → position → punch → shear → unload | hole count and index distance |
| punch-and-bend parts | punch/shear → transfer → bend → inspect | handoff and bend sequence |
| bend-heavy parts | cut blank → multiple bends → gauge | springback setup and handling |
| repeat runners | stored program → stable batch → periodic check | sustained cycle and planned stops |
| custom low-volume parts | programming → setup → first-piece check → run | engineering and changeover time |
For every family, record demand, batch size, route, setup time, run time and yield. A weighted average based only on annual quantities can hide a seasonal or daily bottleneck, so retain both base and peak mix.
The switchgear busbar manufacturing reference provides the wider process context. Capacity begins before the first machine stroke and ends only when an accepted part is available to the next operation.
Measure the Complete Ideal Cycle
Define a repeatable start and stop point. For example: an identified blank is ready at the loading position; the timer stops when the completed part is safely placed in the output location. List any work deliberately excluded.

Break the cycle into observable elements:
- material retrieval and orientation;
- program or job selection;
- loading and datum location;
- positioning between features;
- punching, embossing or shearing actions;
- transfer to bending where applicable;
- bend sequence and gauging;
- unloading and normal in-process checks.
Time several representative cycles after the setup is stable. Do not take the single fastest observed cycle as the planning standard. The ideal cycle should be achievable and repeatable under the defined method, material and quality requirements.
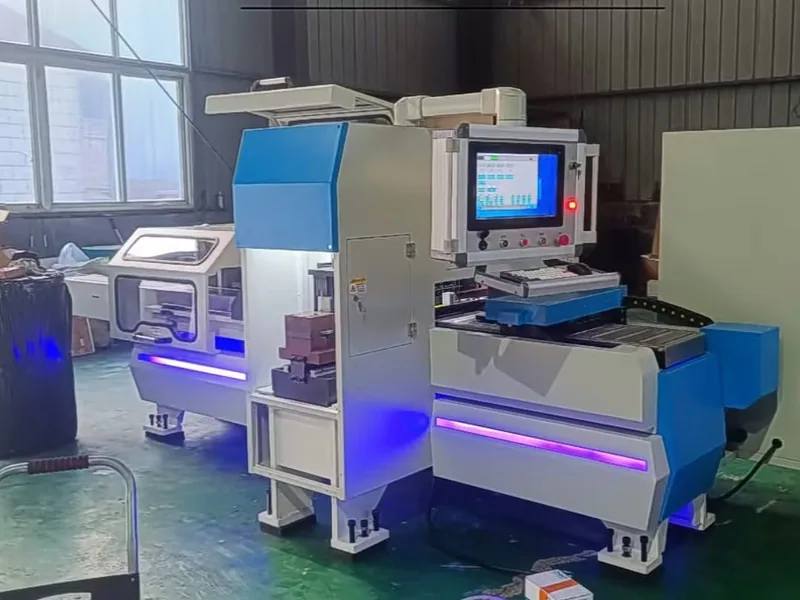
Nominal frequency needs careful interpretation. The DHCNC-BP-60 punching and shearing workstation lists a maximum striking frequency of 110–140 times per minute, depending on operating conditions. That is not 110–140 completed busbars per minute. The part program, travel, feature count, handling and acceptance requirements determine finished output.
Convert Cycle Time Into Good Parts per Shift
At product-family level, a practical formulation is:
Good output = (planned production time ÷ ideal cycle time) × availability × performance × quality
Availability accounts for unplanned stops against scheduled run time. Performance captures running below the ideal rate and short stops. Quality is accepted output divided by total output. This follows the familiar OEE relationship of Availability × Performance × Quality described by OEE.com.
Consider a hypothetical family with:
- 450 planned production minutes in one shift;
- 3.0 minutes ideal cycle time per completed part;
- 85% availability;
- 90% performance;
- 98% quality.
The estimate is:
(450 ÷ 3.0) × 0.85 × 0.90 × 0.98 = 112.455, or approximately 112 accepted parts per shift when whole units are required.
This is an example, not an industry benchmark. A new cell without site evidence should be modeled with a range, then updated with time studies and loss records.
Treat Changeovers as Scheduled Capacity Demand
OEE alone does not rescue a model that omits changeovers. Calculate available run time after planned breaks, meetings, preventive maintenance and scheduled setup. For mixed production, use a period long enough to include the actual number of job transitions.
Suppose the 450-minute shift includes six changeovers at 12 minutes each. The usable run time becomes 378 minutes before the other factors are applied. At the same three-minute cycle and operating factors, output falls to about 94 accepted parts. Reducing setup time or sequencing similar tool families may therefore add more capacity than increasing stroke speed.
Keep programming and first-piece approval visible. If those functions are performed offline, assign the required engineering and inspection capacity rather than assuming they are free.
Find the Real Constraint Across Multiple Stations
For a route that uses punching/shearing and then bending, calculate load at each resource. The route capacity is governed by the smallest effective capacity, adjusted for queues and material transfer.
| Resource | Required minutes per shift | Available effective minutes | Load ratio |
|---|---|---|---|
| punch/shear | 360 | 390 | 92% |
| bending | 420 | 360 | 117% |
| inspection | 110 | 180 | 61% |
In this example, buying a faster punching machine does not solve the shortfall. The bending step needs a method change, more time, different batching or another resource.
A multi-function machine such as the DH303-8P busbar processing machine can reduce transfers and support mixed work. A dedicated punching-and-shearing workstation can suit a flow where that process requires independent capacity. Neither layout is automatically superior; route load and required concurrency decide.
Build Base, Peak and Disruption Scenarios
A single forecast creates false confidence. Use at least three scenarios:

| Scenario | Demand and loss assumptions | Decision use |
|---|---|---|
| base | normal mix, evidenced changeovers and downtime | staffing and routine schedule |
| peak | peak mix, overtime or second shift rules | customer-service resilience |
| disruption | critical tool or machine unavailable, slower replenishment | contingency capacity and spares |
Run sensitivity on the factors that can realistically change: batch size, setup frequency, quality loss, planned minutes and route mix. Do not improve all factors at once to make a proposal fit. Record the owner and evidence for each assumption.
The value of better maintenance should be reflected through the loss model, not a promotional uptime promise. A NIST case on total productive maintenance shows how structured maintenance can reduce downtime and lost capacity in a real manufacturing setting. NIST’s broader maintenance-cost research also frames maintenance as an economic manufacturing issue.
Turn the Model Into a Supplier Test
Include a capacity worksheet with the CNC busbar machine RFQ. Ask each supplier to return:
- proposed route and machine configuration;
- cycle estimate for named reference parts;
- included and excluded work elements;
- number and skill of operators;
- tooling and changeover assumptions;
- material and quality conditions;
- utility and handling dependencies;
- proposed method for confirming the result during FAT.
During acceptance, preserve raw time observations and accepted-part counts. If the supplier demonstrates only a dry cycle or one isolated operation, the evidence cannot validate finished-part capacity.
Finally, keep capacity and business return separate. This calculation answers how much accepted output a configuration can deliver under stated conditions. Capital cost, labor, outsourcing, inventory and cash timing belong in the investment model. Maintaining that boundary prevents a fast machine claim from becoming an unsupported ROI claim.
Frequently Asked Questions (FAQs)
How is busbar machine production capacity calculated?
Calculate each part family's complete ideal cycle, divide planned production time by that cycle, and then apply availability, performance and quality factors. Add changeover and shared-resource constraints before combining product families.
Is strokes per minute the same as finished busbars per hour?
No. Stroke rate describes one machine action under defined conditions. A finished busbar may require multiple holes, indexing, shearing, bending, loading, unloading, inspection and tool changes.
What OEE value should be used for a new busbar machine?
Do not assume an industry average. Build a base case from your downtime, speed-loss and quality evidence, then run peak and disruption scenarios. During sourcing, require suppliers to state the conditions behind any proposed factor.
When are separate punching and bending machines preferable to a three-in-one machine?
Separate stations may suit simultaneous flow, high volume or a route dominated by one process. A three-in-one machine may suit mixed work, lower handoffs and flexible batching. The correct choice follows the product mix and bottleneck model.
DHCNC-BP-60 CNC Punching & Shearing Workstation
Discover details, parameters, standard dies packages, and factory quotes.