
How to Build a QC and Traceability Protocol That Passes Any Global Busbar Buyer's Factory Audit
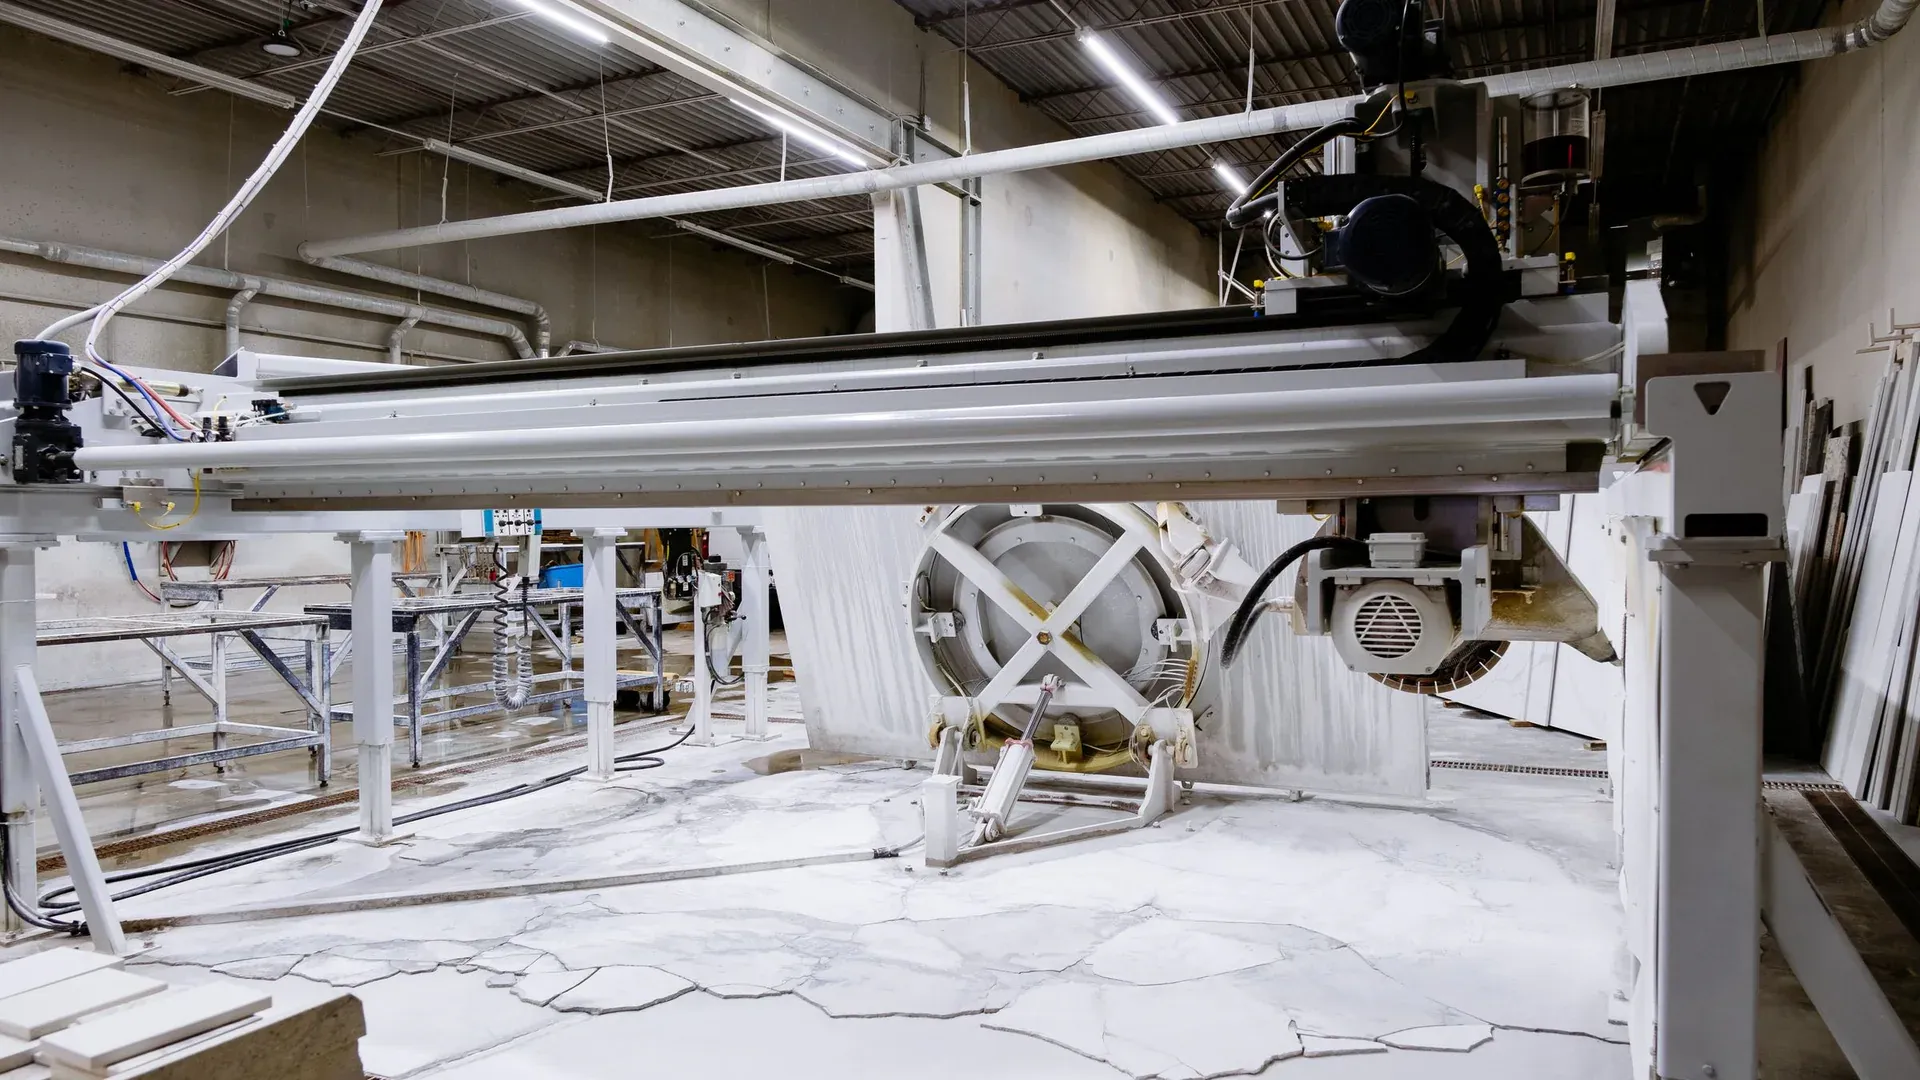
In 15 years of hosting factory audits at DH CNC’s Jinan facility, I have observed that the buyers who ask the sharpest questions during the audit are rarely the ones with the longest supplier qualification checklists. They are the ones who walk directly to the SPC chart display next to the CNC bending center and spend five minutes studying the X-bar and R charts for hole position accuracy on the current production lot. A supplier can prepare for a checklist audit in a weekend. A supplier cannot fake six months of in-control SPC data.
IATF 16949:2016 mandates that safety-critical characteristics—which for busbars include creepage distance, edge radius, inter-layer alignment in laminated assemblies, and bolted joint contact resistance—demonstrate process capability of Ppk ≥1.67 with ongoing SPC monitoring. This is not a paperwork exercise. It requires a measurement system, a data collection infrastructure, a statistical analysis capability, and—most fundamentally—a manufacturing process that is stable enough to produce capable data. A factory running manual hydraulic busbar processing equipment with caliper-based inspection at final QC cannot achieve Ppk ≥1.67 on edge radius because the process has too much inherent variation and the measurement system lacks sufficient resolution. A factory running a CNC busbar processing workstation with automated dimensional logging and closed-loop tool wear compensation can—and the SPC data proves it.
What Are the 12 QC Gates for Busbar Production—and Which Ones Do Auditors Actually Check?
The full production quality control framework for busbar fabrication spans 12 gates from incoming raw material to final shipment. In our experience hosting audits for Tier-1 automotive customers, utility qualification bodies, and data center equipment purchasers, auditors consistently focus on gates 1, 5, 6, 9, and 12—not because the other gates are unimportant, but because these five reveal whether the quality system is operational or decorative.

| QC Gate | What Is Checked | Measurement Method | Auditor Interest |
|---|---|---|---|
| Gate 1: Raw Material Verification | Mill test reports matched to physical heat numbers on copper/aluminum bars; conductivity verification | Eddy current conductivity meter (% IACS); dimensional check (thickness, width, flatness) | 🔴 High — traceability starts here |
| Gate 2: Incoming Dimensional | Bar thickness, width, flatness against purchase spec | Digital micrometer, granite surface plate + dial indicator | 🟡 Medium |
| Gate 3: Conductivity Verification | % IACS minimum (100% for C11000; 61% for 6101-T6) | Eddy current conductivity meter (Sigmascope or equivalent) | 🟡 Medium |
| Gate 4: CNC Program First Article | First piece from each new CNC program batch: all dimensions verified | CMM or optical measurement system; comparison to CAD model | 🟡 Medium |
| Gate 5: In-Process Punching SPC | Hole position accuracy (X, Y), hole diameter, edge quality | X-bar/R charts; sampling frequency per control plan; ±0.1mm tolerance | 🔴 High — process stability evidence |
| Gate 6: In-Process Bending SPC | Bend angle, bend center position, springback compensation | Angle measurement (digital protractor or CMM); ±0.2° tolerance | 🔴 High — direct evidence of process capability |
| Gate 7: Edge Conditioning | Burr height (max 0.05-0.1mm), edge radius (min 0.5-1.5mm depending on voltage class) | Profile projector at 20×; digital micrometer; visual at 10× | 🟡 Medium |
| Gate 8: Surface Finish | Contact surface Ra (1.6-6.3 μm depending on application) | Contact profilometer; comparison standards | 🟢 Lower |
| Gate 9: Electrical (Contact Resistance) | Bolted joint contact resistance at specified torque | Micro-ohmmeter (4-wire Kelvin); target <15-25 μΩ depending on application | 🔴 High — field performance predictor |
| Gate 10: Partial Discharge (>800V) | PD level at specified test voltage per IEC 60270 | PD detector; <10pC at 1.2kV AC typical for 800V EV busbars | 🔴 High for HV applications |
| Gate 11: Dimensional Final | Critical dimensions on statistical sample | CMM, optical comparator, or laser scanner per control plan | 🟡 Medium |
| Gate 12: Traceability Audit | Forward and backward traceability from heat number → production lot → shipment | ERP system audit; physical label verification; mock recall exercise | 🔴 High — the system integration gate |
The five high-auditor-interest gates share a common characteristic: they cannot be satisfied by a final inspection step. They require the quality system to be embedded in the production process itself.
How Does CNC Automation Deliver the Process Capability That Manual Processing Cannot?
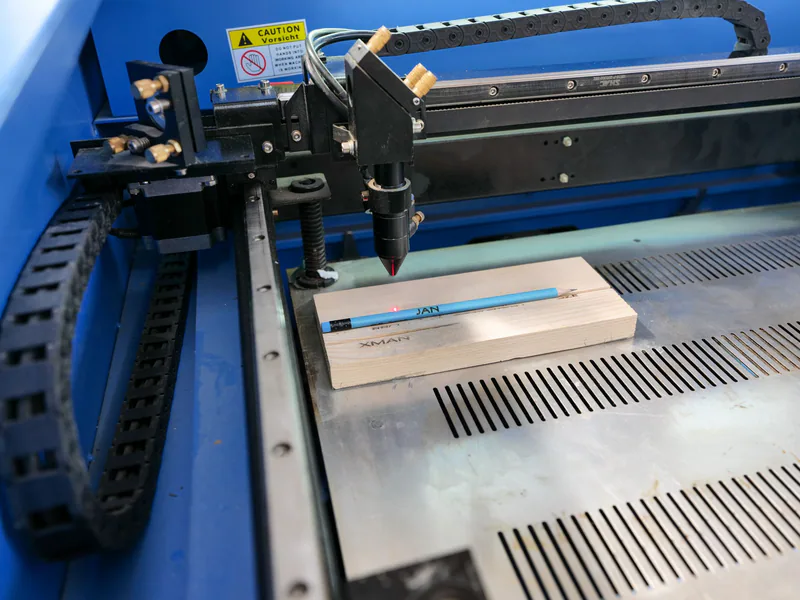
The difference between manual and CNC busbar processing on process capability metrics is not incremental—it is categorical. Here is the data from our own production floor, comparing manual hydraulic processing (the baseline that many of our customers are upgrading from) with our DHCNC-BP-60 CNC workstation:
| Capability Metric | Manual Hydraulic (Typical) | CNC (DHCNC-BP-60 Measured) | Improvement |
|---|---|---|---|
| Hole position Cpk (X-axis) | 0.8-1.2 | 1.67-2.2 | 1.5-2× |
| Hole position Cpk (Y-axis) | 0.7-1.1 | 1.67-2.0 | 1.5-2× |
| Bend angle Cpk (±0.5° tolerance) | 0.9-1.3 | 1.67-2.5 | 1.3-2× |
| Bend center Cpk (±0.3mm tolerance) | 0.6-1.0 | 1.67-2.1 | 1.7-2.5× |
| Shear length Cpk (±0.5mm tolerance) | 1.0-1.4 | 1.67-2.3 | 1.2-1.7× |
| Contact surface Ra Cpk | 1.0-1.5 | 1.67-2.0 | 1.1-1.7× |
| Setup time (part changeover) | 25-45 minutes | 3-8 minutes | 5-8× faster |
| SPC data logging | Manual (paper form, ~30% compliance) | Automated (100% compliance) | Complete |
The Cpk improvement from CNC automation has a direct commercial consequence: customers with Cpk ≥1.67 requirements (which includes every IATF 16949 automotive customer and an increasing number of utility and data center buyers) cannot qualify a manual-processing supplier regardless of how diligent the operators are. The process simply has too much inherent variation.
The automated SPC logging is particularly valuable during customer audits. When an auditor asks to see six months of control chart data for hole position on a specific part number, a CNC machine with integrated data logging retrieves it in seconds. A manual shop produces a binder with incomplete records and apologizes for the gaps. I have seen both scenarios play out in our own customer audits, and I can tell you which one ends with an approved supplier status.
What Does Full Material Traceability Actually Require in a Busbar Production Environment?
For battery customers preparing for 2027, the EU battery-passport supplier-data guide explains how to package this evidence. Component traceability supports the battery maker’s data obligations; it does not require a separate battery passport for every copper part.
Traceability is the thread that connects a busbar installed in a switchgear panel in Monterrey, Mexico to the copper atom that was refined in Chuquicamata, Chile. IATF 16949 Clause 8.5.2 requires that “the organization shall identify the product status with respect to monitoring and measurement requirements throughout product realization” and maintain traceability of the product output relative to its inputs. In busbar fabrication, this means:
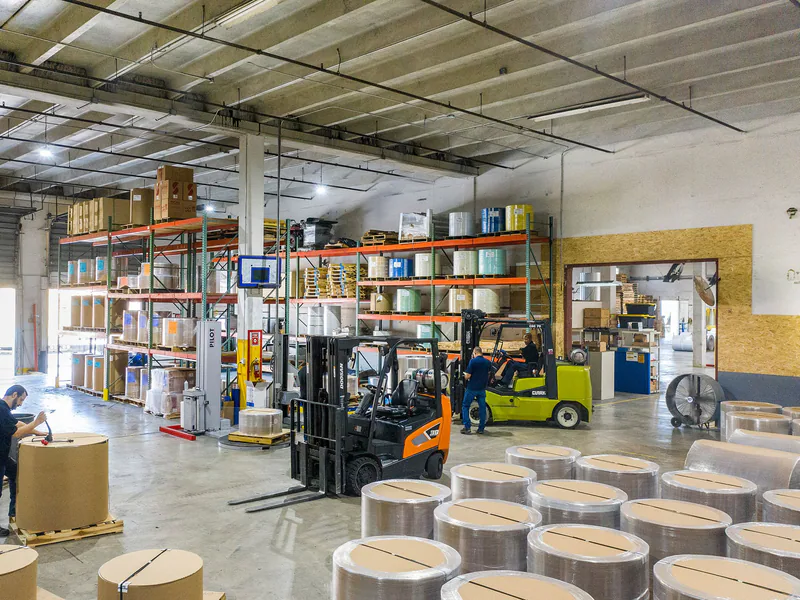
Incoming traceability. Every copper or aluminum bar received at the factory must be tagged with:
- Mill heat number (unique identifier assigned by the copper/aluminum mill)
- Mill test report (chemical composition, mechanical properties, conductivity)
- Receiving date and purchase order reference
- Physical location in raw material inventory
In-process traceability. As bars move through punching, shearing, bending, plating, and assembly:
- Each production lot is assigned a unique lot/batch code that links to the incoming heat number(s) consumed
- In-process inspection records (SPC data, dimensional checks, visual inspections) are logged against this lot code
- Any non-conforming material is segregated and its disposition (rework, scrap, use-as-is with concession) is documented against the lot code
Outgoing traceability. At shipment:
- The packing list includes the lot/batch code for every busbar or busbar assembly in the shipment
- The Certificate of Conformance references the lot code and the underlying material certificates
- In the event of a field quality issue, the lot code enables a mock recall: within 4 hours, the supplier should be able to identify every busbar in the lot, the heat numbers of the raw material consumed, the production dates, the specific CNC machines and operators involved, and the in-process inspection results
This traceability infrastructure requires an ERP system that links purchasing, inventory, production, quality, and shipping modules. It does not require a $500,000 SAP implementation—practical ERP solutions suitable for mid-size busbar fabricators are available—but it does require that the system be used consistently. The most common traceability failure we observe in supplier audits is not a lack of systems but a lack of discipline: operators bypassing the lot-code entry step because “it’s the same material as the last batch.” It is precisely that bypass that creates a traceability gap that an auditor will find.
Why Is Contact Resistance Testing the Single Most Revealing QC Measurement?
If I could perform only one quality test on a busbar production lot—and I had to stake the factory’s qualification status on the result—I would choose bolted joint contact resistance measurement using a 4-wire Kelvin micro-ohmmeter. Here is why.

Contact resistance is a composite indicator. A resistance value above the specification limit can be caused by inadequate surface finish (rough surface → fewer asperity contacts → higher resistance), insufficient joint torque (lower clamping force → smaller contact area), surface contamination or oxidation (insulating layer between conductors), dimensional error (misaligned bolt holes → reduced overlap area), or burrs or debris trapped in the joint interface. A single measurement instantly flags problems in punching, shearing, surface finishing, assembly, and operator training. It is the canary in the coal mine for busbar quality.
Our specification for busbar bolted joints varies by application:
| Application | Target Contact Resistance | Test Current | Standard |
|---|---|---|---|
| LV switchgear busbar joint (<1,000V) | <25 μΩ | 100A DC | IEC 61439-1 |
| MV switchgear busbar joint (1-36kV) | <20 μΩ | 100A DC | IEC 62271-1 |
| EV battery busbar interconnect | <15 μΩ | 100A DC | Customer specification (typically < 15 μΩ @ 100A) |
| Data center busbar trunking splice | <10 μΩ | 200A DC | Customer specification |
The measurement must be performed with a properly calibrated 4-wire (Kelvin) micro-ohmmeter at a test current sufficient to overcome surface film effects—typically 100A DC for switchgear busbar joints. A standard multimeter in resistance mode will not produce reproducible results because the test current (typically 1mA or less) is too low to break through surface oxide films.
For our customers implementing in-house QC systems, we recommend procuring a micro-ohmmeter with data logging capability (models from Megger, AEMC, or Raytech are commonly used in the industry) and integrating contact resistance measurements into the SPC data collection workflow. The data trend over time reveals joint degradation mechanisms—gradually increasing contact resistance across a production lot signals tooling wear or surface preparation drift—that a pass/fail measurement at final inspection would miss.
How Should Buyers Structure a Supplier Audit to Test Traceability Under Stress?
The audit technique that consistently reveals the difference between a documented quality system and an operational one is the traceability walk-back: the auditor selects a finished busbar from the shipment staging area, reads the lot code, and asks the supplier to trace it backward through every production step to the raw material heat number—in real time, on the factory floor, without preparation. A supplier with an integrated ERP-to-production data flow can complete this walk-back in under 15 minutes. A supplier with paper records and manual data entry cannot—and the gaps in their traceability chain become visible within the first 30 minutes of the audit.

At DH CNC, we recommend that buyers conducting supplier audits include these five stress-test exercises:
-
Random lot traceability walk-back. Select any busbar in finished goods. Trace to incoming heat number within 30 minutes. Any gap in the chain is a finding.
-
SPC data retrieval for a part shipped 6 months ago. Can the supplier retrieve the in-process control charts for a historical production lot? If not, their data retention does not meet IATF 16949 requirements.
-
Measurement system GR&R on the production floor. Ask to see a Gauge Repeatability and Reproducibility study for the measurement equipment used on critical characteristics. If the supplier does not know what GR&R is, their measurement data is not reliable regardless of what the control charts show.
-
Non-conforming material segregation walk. Walk the production floor and identify where rejected material is held. Verify that it is physically segregated and labeled with disposition status. Unsegregated reject material in the production area is a major finding.
-
Calibration status of shop-floor instruments. Spot-check calibration stickers on micrometers, calipers, and go/no-go gauges in active use. An expired calibration sticker on a tool being used for acceptance inspection invalidates the inspection data.
For the companion guide covering the broader factory evaluation framework, see our article on how to qualify a CNC busbar machine supplier in China with the 2026 procurement checklist. For guidance on verifying and auditing a busbar machine factory in China, we cover the physical infrastructure and equipment capability evaluation that complements this QC protocol.
For part-level evidence, adapt our finished copper busbar inspection checklist to the drawing and control plan. Where electrical joints are in scope, the contact-resistance, torque and plating guide explains how to set a baseline without inventing a universal resistance limit.
Frequently Asked Questions (FAQs)
What are the 12 QC gates that a busbar factory must pass for IATF 16949 compliance?
The 12 gates span incoming material through final shipment: (1) Raw Material Certificate Verification—mill test reports matched to heat numbers; (2) Incoming Dimensional—sampling inspection of bar thickness, width, flatness; (3) Conductivity Verification—eddy current or bridge method confirming % IACS minimum; (4) CNC Program Verification—first-article dimensional inspection against CAD model; (5) In-Process Punching SPC—X-bar/R charts on hole position at defined sampling frequency; (6) In-Process Bending SPC—bend angle and center position control charts; (7) Edge Conditioning Inspection—burr height and edge radius measurement at 10-20× magnification; (8) Surface Finish Verification—contact surface Ra measurement per specification; (9) Electrical—contact resistance measurement on bolted joints (target <15-25 μΩ); (10) Partial Discharge Testing (for >800V applications)—IEC 60270 at specified voltage; (11) Dimensional Final Inspection—CMM or optical measurement of critical characteristics; (12) Material Traceability Audit—forward/backward traceability from heat number to shipment lot.
How does CNC automation improve process capability (Cpk/Ppk) for busbar fabrication?
CNC busbar processing machines improve Cpk values through three mechanisms: (1) Repeatability—servo-driven axis positioning eliminates the operator-to-operator variation that is the largest source of process spread in manual fabrication. A CNC bending center holding ±0.2° bend angle repeatability across 1,000+ parts produces a Cpk of 1.67-2.0+ on bend angle, while manual bending typically achieves Cpk of 0.8-1.2; (2) Automated quality data logging—every punched hole position, bend angle, and shear length is recorded with timestamp and operator ID, creating the data set required for SPC charting without manual data entry; (3) Closed-loop compensation—advanced CNC systems monitor process drift (e.g., tool wear causing gradual positional offset) and automatically apply compensation, maintaining Cpk within specification throughout the production run rather than requiring operator intervention when parts begin drifting out of tolerance.
What documentation package do global buyers expect from a qualified busbar supplier?
The standard documentation package for production busbar shipments includes: (1) Material certificates (mill test reports) for each heat number of copper or aluminum used, showing chemical composition and mechanical properties; (2) First-Article Inspection Reports (FAIR) per AS9102 or customer-specific format for new part numbers; (3) In-process SPC data (control charts) for critical characteristics identified in the PFMEA; (4) Certificate of Conformance (CoC) signed by the quality manager; (5) Plating/coating batch certificates with thickness measurements; (6) Partial discharge test reports (for >800V applications) per IEC 60270; (7) Dimensional inspection reports for the shipped lot with traceability to the specific CNC machine and operator; (8) Packing list with unique lot/batch identification linking each busbar to its production records. This package should be organized for electronic submission in the customer's quality portal format.
DHCNC-BP-60 CNC Punching & Shearing Workstation
Discover details, parameters, standard dies packages, and factory quotes.