
XRF Plating Thickness for Copper Busbars: Sampling and Interpretation
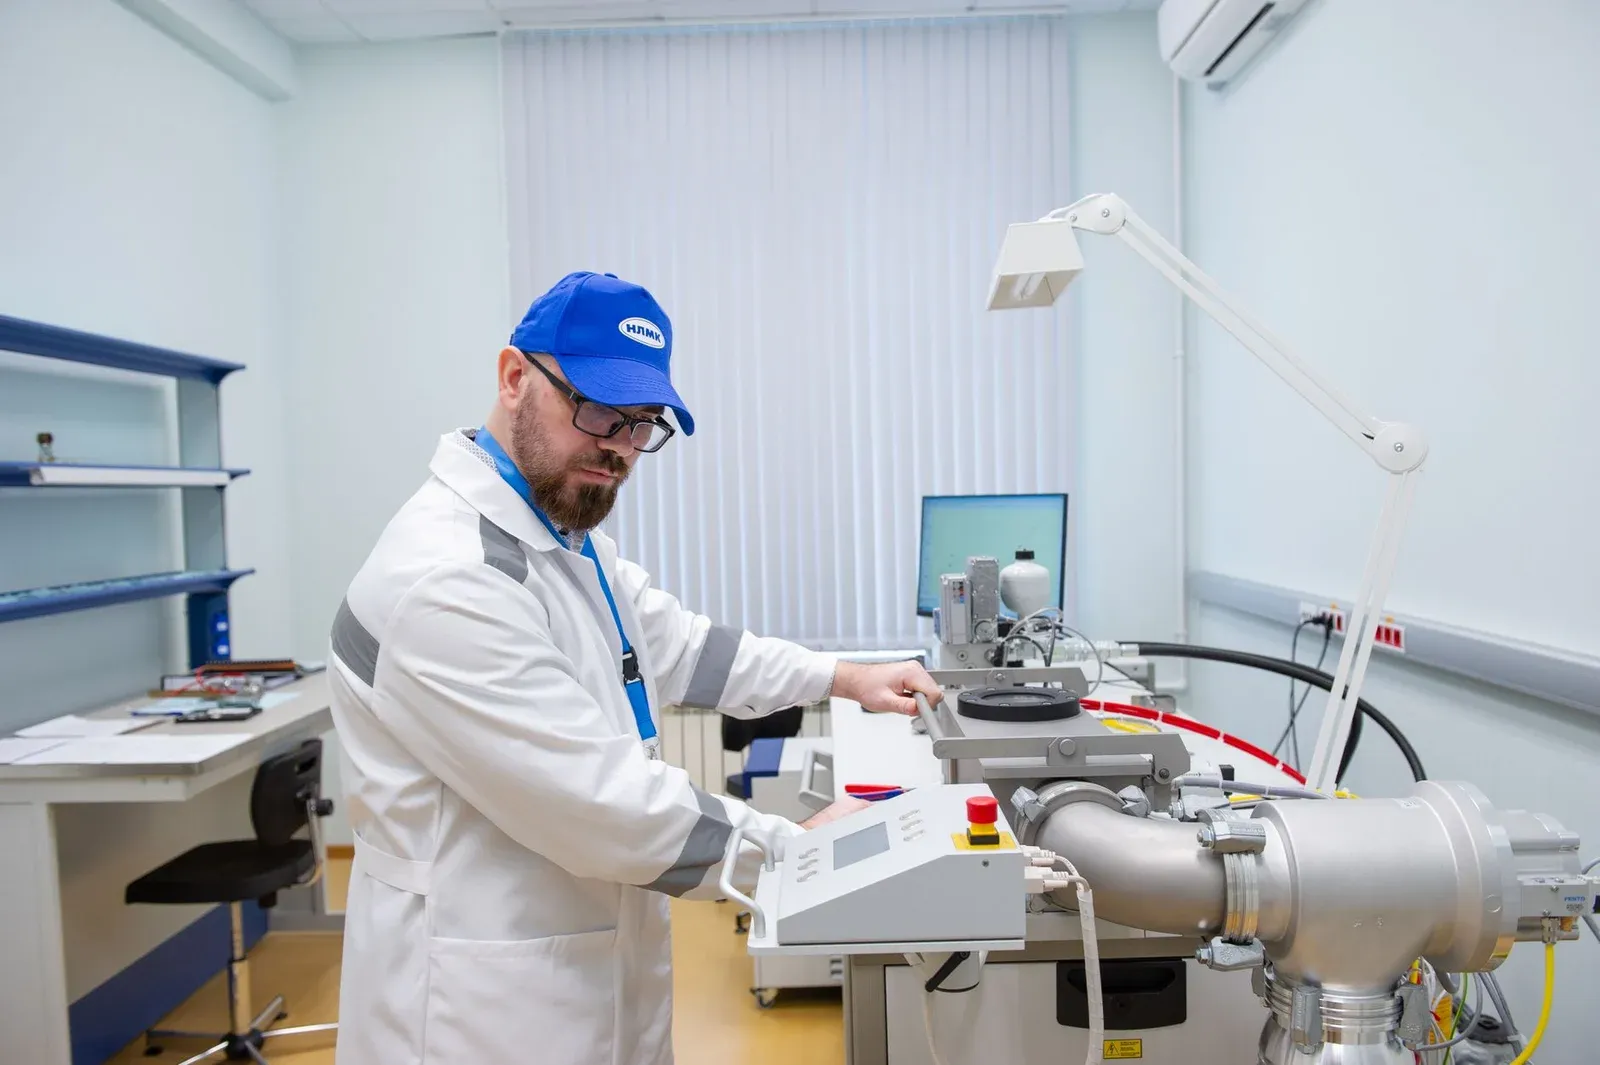
X-ray fluorescence can provide fast, non-destructive thickness data for plated copper busbars, but the number on the screen is not self-validating. The result depends on the coating stack, substrate, calibration, measurement geometry, spot location, instrument method, and the uncertainty around the reported value.
A defensible inspection plan therefore does more than name “XRF” on the purchase order. It identifies the governing method and coating specification, builds a representative calibration, maps risk-based locations on the part, controls geometry, defines how near-limit results are handled, and retains the raw data with the production lot.
What XRF Can—and Cannot—Verify on a Busbar
An XRF instrument irradiates the measurement area and detects characteristic fluorescent X-rays from elements in the coating and substrate. With a suitable model or calibration, the signal can be related to coating thickness. The method is attractive for busbars because it can sample multiple locations without cutting every finished part.
However, XRF does not directly prove every property required from plating. A thickness result does not establish adhesion, porosity, solderability, corrosion performance, contact-face cleanliness, dimensional conformity, or joint resistance. It also does not show the entire surface; it represents the instrument’s measurement spot under the stated conditions.
Use the tin-versus-silver busbar surface-treatment guide to select a finish from electrical, environmental, process, and cost requirements. This article begins after the finish and acceptance requirements have been defined.
Match the Method to the Coating Stack and Contract
ASTM B568 covers measurement of coating thickness by X-ray spectrometry, while ISO 3497 addresses X-ray spectrometric methods for metallic coatings. The purchase specification must identify the required method and edition, plus any customer-specific procedure. Merely writing “test by XRF” leaves calibration, locations, and acceptance unresolved.
Describe the complete stack. Examples might be tin over copper, silver over copper, or a top coating over an intermediate layer and copper substrate. The instrument method must distinguish the relevant elements and model the layer sequence. If the substrate alloy or intermediate layer changes, the old calibration may no longer be appropriate.
State the nominal and acceptance range from the applicable part specification. Do not borrow a thickness value from another busbar application. A plating requirement can differ with joint design, exposure, mating material, temperature, wear, and customer standard.
If XRF is the production-control method but a cross-section method is the contractual referee for disputes, say so in advance. Define who selects the sample, where it is sectioned, and how destructive results are reconciled with the XRF map.
Build a Calibration That Resembles the Actual Part
Use reference standards that cover the expected coating range and resemble the coating/substrate system. Record the standard IDs, certified values, validity, and traceability. Confirm that the instrument method uses the correct elements, layer order, density or model assumptions, collimator, measurement time, and calibration curve.
Run a verification check before the batch and at a defined interval or after relevant changes. A passing check at one thickness does not automatically validate the complete working range. Include a blank or substrate check when the method requires it, and investigate drift rather than applying an undocumented offset.
Instrument suppliers such as Hitachi describe dedicated XRF systems for coating analysis. Use manufacturer instructions for the specific instrument, but keep the acceptance method under the buyer’s controlled specification rather than relying on a default factory program name.
Measure a stable reference sample after maintenance, tube replacement, detector service, software changes, or method edits. Retain the pre- and post-change results so continuity can be assessed.
Control Geometry Before Trusting the Reading
XRF intensity depends on measurement geometry. A flat contact face positioned consistently is simpler than a narrow edge, curved bend, rough surface, or feature smaller than the measurement spot. Tilt and changing distance can alter the result; an edge may allow part of the beam or detection area to miss the coating.
Define a fixture or stage position that locates the busbar repeatably. Select an aperture or collimator appropriate to the available flat area. Confirm the measurement spot visually when the instrument supports it. Keep the target area clean and avoid measuring over dirt, oil, labels, scratches, or a boundary between plated and masked regions.
Do not “hunt” for a passing point. If the specified zone includes a small terminal or curved region, validate a method for that geometry or select an agreed alternative test. The report should distinguish standard flat-face readings from any geometry-specific reading.
Surface roughness and an uneven deposit can create real local variation as well as measurement variation. Repeated readings after repositioning help show whether the issue follows the part or the setup.
Use a Sampling Map Instead of One Convenient Point
Plating distribution can vary with rack position, current density, shielding, part orientation, holes, edges, bends, and distance from electrical contacts in the plating process. One central reading on one busbar cannot represent every contact face and lot.
Build a drawing-based map. Depending on risk and process knowledge, it can include:
| Zone | Reason to sample | Control note |
|---|---|---|
| Primary contact faces | electrical and mechanical interface | use repeatable flat locations away from boundaries |
| Opposite ends of a long bar | possible distribution gradient | keep offset from edges consistent |
| Areas near holes or slots | local geometry can affect deposition | validate spot fit and distance from the edge |
| Inside and outside bend regions | orientation and geometry may differ | use only a validated curved/adjacent-flat method |
| Parts from different rack positions | captures process distribution | link readings to rack and lot identity |
Set lot definition and sampling frequency from process risk, historical capability, customer requirements, and the cost of escape. New chemistry, rectifier settings, rack design, supplier, part geometry, or rework may justify increased sampling until the process is stable.
Interpret Results With Uncertainty and Guard Bands
Retain individual readings, not only an average. A mean can pass while one required contact zone is below its minimum. Record repeat readings and any rejected measurement with a reason; never delete an outlier simply because it is inconvenient.
Measurement uncertainty matters near a specification limit. Agree whether a guard band is used, how uncertainty is estimated, and what happens when a reading falls in the decision zone. Appropriate actions can include repeat measurement after verified repositioning, reference-standard checks, expanded sampling, or an agreed referee method.
Use control charts or trend analysis for a stable process, but do not confuse a statistically stable mean with specification compliance. A process can be consistently off target. Conversely, aggressive adjustment after every small reading fluctuation can increase variation.
If supplier and customer instruments disagree, compare method files, calibration standards, apertures, measurement time, geometry, and sample orientation using retained parts. “Both instruments are XRF” does not make their results directly comparable.
Pair Thickness Data With the Other Evidence the Joint Needs
The coating system must also meet the specified surface condition and performance checks. Depending on the contract, evidence may include adhesion, porosity or corrosion testing, visual condition, dimensions after coating, masking boundaries, and cleanliness. The finished-busbar inspection checklist places those checks in the full release sequence.
For bolted contact areas, thickness data should be read alongside flatness, damage, contamination, mating materials, hardware, and controlled tightening. The joint contact-resistance guide explains why a coating reading cannot by itself prove the assembled electrical interface.
When the busbar supports a regulated product or customer traceability system, connect the coating batch and inspection result to the same stable identifiers used for material and drawing revision. The data approach in the battery-passport supplier guide is useful even when the component does not own a product passport.
Specify the Supplier Record
Require the report to identify part number and revision, material lot, plating batch, coating stack, applicable specification, lot size, sampled parts, mapped locations, instrument and serial number, method file and revision, calibration standards, check results, raw readings, units, uncertainty or decision rule where required, operator, date, and disposition.
Photographs of the fixture and measurement zones reduce later ambiguity. Store records in a format that preserves individual values and can be searched by lot. A screenshot showing one green result is not a batch record.
XRF is most valuable when it is part of a controlled process. With the right model, calibration, geometry, sampling, and decision rules, it converts a vague plating claim into traceable evidence without pretending that one thickness number proves the entire joint.
Frequently Asked Questions (FAQs)
Does XRF damage a plated copper busbar?
Routine XRF coating-thickness measurement is generally non-destructive at the measured location. The method still requires radiation controls, suitable calibration, correct geometry, and a coating/substrate model that matches the part.
Can XRF measure multilayer coatings on copper busbars?
It can analyze supported coating stacks when the instrument method, calibration standards, layer sequence, elements, and thickness ranges are suitable. Closely related elements or an incorrect model can make the reported layer thickness unreliable.
Why can XRF readings near a busbar edge or bend be unstable?
Edges, curvature, roughness, tilt, spot overlap, and changing distance can alter the X-ray geometry and detected intensity. Use a controlled fixture and agreed measurement zones, or validate a geometry-specific method before accepting those readings.
Does a passing XRF thickness result prove low contact resistance?
No. Thickness is one characteristic. Contact performance also depends on coating integrity, porosity, contamination, contact-face flatness, joint design, hardware, tightening, environment, and the underlying copper condition.