
How to Design a Tier-1 EV Busbar Production Line for 5,000 Units Per Day

The most expensive mistake I see in EV busbar manufacturing is not buying the wrong machine — it is buying the right machines and arranging them in the wrong sequence. At DH CNC, our factory in Jinan has designed and commissioned complete production lines for Tier-1 suppliers across Europe and North America, and the single biggest determinant of whether a line hits its 5,000-unit/day target is not motor horsepower or bending tonnage. It is the spatial relationship between the receiving dock, the copper coil storage, the punching station, the bending cell, the vision inspection gantry, and the finished-goods buffer. According to McKinsey’s 2026 Global Manufacturing Report, automotive component plants that implement cellular manufacturing layouts reduce work-in-process inventory by 42% and improve throughput by 28% compared to traditional departmental layouts. The global EV busbar market is projected to reach $2.5 billion in 2026, up from $2.0 billion in 2025 (+25.3% YoY), driven by 800V architecture adoption across both passenger and commercial EV platforms. This article is a practical, ground-level guide to designing a production line that actually delivers — drawn from a real project where we helped a European Tier-1 supplier go from 800 units/day to 5,200 units/day without adding a single square meter of floor space.
Why Does Factory Floor Layout Determine Your Throughput More Than Machine Speed?
Most procurement engineers fixate on cycle time — how many seconds a punch cycle takes, how fast the bending beam retracts. Those numbers matter. But what matters more is the distance copper travels between operations and the time it spends waiting. In a poorly laid-out line, a busbar that takes 60 seconds of actual machine time can spend 12 minutes sitting on a pallet, waiting for the next station to clear.
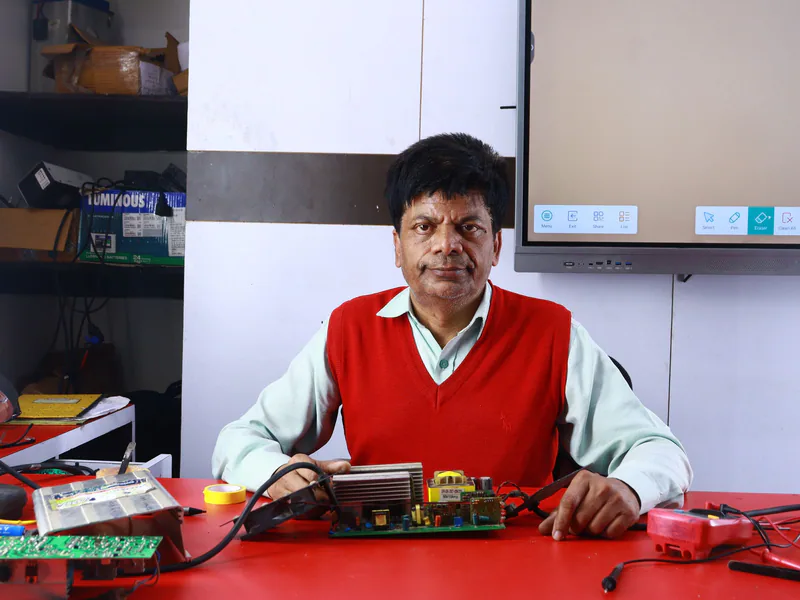
At DH CNC, we apply a principle borrowed from Toyota’s lean manufacturing playbook: design the cell around the part, not the machine. The most effective layout we have deployed for EV busbar production is the U-shaped cellular configuration, which directly addresses three bottlenecks that kill throughput:
-
Excessive material travel distance. In a departmental layout where punching machines sit in one hall and bending machines in another, copper bars travel 80-150 meters between operations. In a properly designed U-cell, the distance drops to 8-15 meters.
-
Operator walking waste. When one operator tends three machines arranged in a straight line, they walk roughly 40 meters per cycle. In a U-cell, the same three machines are within a 3-meter radius. Over an 8-hour shift, that difference adds up to approximately 6 kilometers less walking — time that converts directly into productive machine-tending.
-
Work-in-process pileup. Linear layouts encourage batch processing. An operator runs 100 pieces through punching, stacks them, then moves the stack to shearing. U-cells enforce one-piece flow: a single busbar moves through all three operations before the next one starts. This eliminates WIP inventory and catches quality defects within seconds rather than hours.
| Layout Type | Material Travel Distance (per unit) | Operator Walking per Shift | WIP Inventory | Typical OEE |
|---|---|---|---|---|
| Departmental (Linear) | 80-150 m | ~18 km | 2-4 hours of buffer | 55-65% |
| Straight-Line Cell | 20-40 m | ~10 km | 30-60 minutes of buffer | 65-75% |
| U-Shaped Cellular | 8-15 m | ~4 km | < 5 units (one-piece flow) | 80-88% |
| Parallel U-Cells with Central Tooling | 10-20 m | ~5 km | < 10 units | 82-90% |
For high-mix EV busbar production — where a single Tier-1 supplier might produce 15-30 distinct busbar part numbers for different battery pack configurations — we recommend parallel U-cells connected by a central tooling and die maintenance zone. Each cell is dedicated to a part family with similar dimensions (e.g., Cell A handles 3-5mm copper at 20-60mm width; Cell B handles 6-8mm copper at 80-120mm width). The central tooling zone allows die sets to be pre-staged on rolling carts, and changeovers that would take 45 minutes in an isolated cell drop to 12-15 minutes because tooling preparation happens offline, in parallel with production.
How Do You Calculate Realistic Production Capacity for an EV Busbar Line?
The math is straightforward but most factories get it wrong because they use theoretical cycle times instead of real-world numbers. Here is the capacity formula we use at DH CNC when scoping a new line for a client:
Required Stations = (Daily Target Units × Weighted Average Cycle Time in seconds) ÷ (Available Work Seconds × OEE)
Let me break this down with the real numbers from our European Tier-1 project.
Step 1: Define the daily target. The client needed 5,000 finished busbar units per day, operating two 8-hour shifts (16 hours total, with 30 minutes of unpaid break per shift). That gives us: 2 shifts × (8 hours - 0.5 hours) × 3,600 seconds = 54,000 available work seconds per day.
Step 2: Calculate the weighted average cycle time. This is where the nuance lives. An EV battery pack typically requires 3-5 distinct busbar geometries: a main DC-link busbar (large, 100-120mm wide, 6-8mm thick), two-to-three module interconnectors (medium, 40-60mm wide, 3-5mm thick), and occasionally a flexible laminated connector. Each has a different processing time on a 3-in-1 CNC workstation.
Consider this real part mix from the project:
| Busbar Type | Quantity per Pack | Punching (sec) | Shearing (sec) | Bending (sec) | Total Cycle (sec) |
|---|---|---|---|---|---|
| DC-Link Main Busbar (120×8mm, 4 bends, 6 holes) | 1 | 18 | 8 | 45 | 71 |
| Module Interconnector A (50×5mm, 2 bends, 4 holes) | 2 | 12 | 6 | 28 | 46 |
| Module Interconnector B (40×4mm, 1 bend, 3 holes) | 1 | 10 | 5 | 22 | 37 |
| Flexible Laminated Connector (60×3mm, 2 bends) | 1 | 14 | 7 | 32 | 53 |
The weighted average cycle time = (1×71 + 2×46 + 1×37 + 1×53) ÷ 5 = 50.6 seconds per busbar.
Step 3: Apply OEE. No production line runs at 100%. Tooling changes, preventive maintenance, operator breaks, and occasional material jams all eat into available time. For a well-designed EV busbar line with quick-change tooling and trained operators, 85% OEE is a realistic target. That means effective work time = 54,000 × 0.85 = 45,900 seconds.
Step 4: Calculate required stations. Required stations = (5,000 × 50.6) ÷ 45,900 = 5.51 stations → round up to 6 stations.
We commissioned the line with six DH303-8P multi-function workstations arranged in three parallel U-cells (two stations per cell). The line hit 5,200 units/day within the second week of production ramp-up. The extra 4% headroom came from operators optimizing their part-handling movements — something no spreadsheet captures but every experienced production engineer knows to leave margin for.
A note on single-function vs. multi-function machines: For lines targeting above 3,000 units/day, we generally recommend 3-in-1 machines like the DH303-8P because they eliminate inter-machine transport. For lines above 8,000 units/day, dedicated single-function machines (separate high-speed punching centers like the DHCNC-BP-60 and dedicated bending cells like the DHAC-BB-H) arranged in sequence can achieve faster individual cycle times, but require more sophisticated material handling automation between stations.
What Does the Optimal Material Flow Look Like from Copper Coil to Finished Busbar?
Material flow is the circulatory system of the production line. Get it right and copper moves like water. Get it wrong and you have forklifts idling, operators waiting, and $10,000+/ton copper sitting on the floor accumulating dings and scratches. Here is the flow architecture we designed for the 5,000-unit/day line:
Zone 1: Receiving and Incoming Inspection (Raw Material Buffer)
Copper arrives as pre-slit coils or cut-to-length bars, depending on the busbar geometry. For high-volume EV busbar production, we strongly recommend specifying pre-slit coil in your exact finished width from the copper mill. This eliminates the in-house slitting operation entirely — a common bottleneck that requires a separate $80,000-$150,000 slitting line, dedicated operator, and generates edge burrs that downstream CNC stations then have to clean up.
Every coil or bar lot undergoes incoming inspection before it enters the production floor. We specify a portable Eddy Current conductivity meter (Sigmascope SMP350 or equivalent) and a digital micrometer with 0.001mm resolution at this station. Copper conductivity must be verified at >98% IACS (International Annealed Copper Standard) for T2 copper destined for EV applications. A single lot of sub-spec copper that reaches the bending station will produce thousands of defective busbars before anyone notices — and in automotive, that means a containment hold on your entire shipment.
Zone 2: De-coiling and Straightening (Only for Coil-Fed Lines)
For lines processing from coil, a motorized decoiler with loop control feeds a precision straightening unit. The straightener uses 7-9 rollers in an offset pattern to reverse the coil set curvature. This is a deceptively critical station because residual curvature after straightening directly affects bend angle accuracy downstream. We calibrate straightener roller pressure weekly using a granite surface plate and feeler gauge check — a 15-minute procedure that prevents days of mysterious angle drift.
Zone 3: CNC Processing Cell (Punch → Shear → Bend)
This is the heart of the line. In each U-cell, two DH303-8P 3-in-1 workstations are positioned at 120-degree angles relative to each other, allowing one operator to tend both stations with a simple pivot movement. The material enters the first station for punching and shearing, then the semi-finished bar is placed on a gravity roller conveyor — literally a $200 piece of hardware — that carries it 1.5 meters to the bending station. No forklift. No pallet. No WIP rack. The busbar spends less than 30 seconds between stations.
For burr-critical EV applications (any busbar operating above 400V DC), we configure the punching station with Cr12MoV vacuum-hardened tool steel dies hardened to HRC 58-62. These dies maintain edge sharpness for approximately 80,000-120,000 punch cycles on 5mm T2 copper before requiring re-grinding. The station PLC tracks punch count and flags the operator when dies approach their service interval.
Zone 4: Inline Vision Inspection
Immediately after the last bending operation, each busbar passes through an automated vision inspection station. We typically integrate a Cognex In-Sight 9000 series or Keyence CV-X series camera system mounted on a fixed gantry over the exit conveyor. The system checks:
- Hole presence, diameter, and position (tolerance: ±0.1mm)
- Bend angle verification via edge detection (tolerance: ±0.3 degrees)
- Surface defect detection (scratches deeper than 0.05mm flagged for review)
- Overall length and width within specification
Parts that pass proceed to the electrical test station. Parts that fail are diverted to a quarantine bin with the vision system logging the specific failure mode — this data feeds directly into the daily production quality review.
Zone 5: Electrical Testing and Final QC
Every automotive busbar undergoes 100% electrical testing. For DC-link busbars, we use a HI-POT (High Potential) tester applying 2× rated voltage + 1,000V for 1 second with leakage current threshold <1mA, per IEC 60664-1. For module interconnectors, a micro-ohmmeter measures contact resistance at each connection interface — typical acceptance criteria is <5 micro-ohms at each bolted interface, verified against the OEM’s specific drawing requirements.
This is also where Coordinate Measuring Machine (CMM) sampling happens. We specify 1 unit per 200 produced for CMM verification of all critical-to-quality dimensions, with the results stored in the production database. For automotive PPAP (Production Part Approval Process) submissions, this CMM data becomes part of the dimensional results package.
| Production Zone | Equipment Required | Floor Space (approx.) | Key Process Metric |
|---|---|---|---|
| Receiving & Inspection | Eddy current meter, digital micrometer, hardness tester | 40-60 m² | Copper conductivity >98% IACS |
| De-coiling & Straightening | Motorized decoiler, 9-roller straightener | 30-45 m² | Residual curvature <0.5mm/m |
| CNC Processing Cell (per U-cell) | 2× DH303-8P workstations, roller conveyor | 35-50 m² | Takt time ≤51 sec/unit |
| Inline Vision Inspection | Cognex/Keyence vision system, gantry mount | 15-20 m² | False reject rate <0.5% |
| Electrical Test & Final QC | HI-POT tester, micro-ohmmeter, CMM (sampling) | 25-35 m² | Zero HI-POT failures at customer |
| Packaging & Dispatch | Anti-corrosion VCI packaging station, label printer | 30-40 m² | Shipment accuracy 100% |
How Should Quality Control Be Integrated Into the Line Rather Than Bolted On?
The traditional approach — making all the parts, then inspecting a sample at the end — is incompatible with automotive Tier-1 supply. By the time an end-of-line inspector catches a burr issue, the upstream station may have already produced 300 defective parts. At LME copper prices hovering between $10,000 and $13,500 per ton in mid-2026, those 300 scrapped busbars represent not just lost labor but $400-$800 in raw material that goes back to the recycler at 30-40% of purchase price.
We design three mandatory quality gates into every EV busbar line:
Gate 1: Incoming Material (before Zone 3 entry). Every coil or bar lot is checked for conductivity, thickness, width, and hardness. T2 copper for EV busbars should register 60-70 HRB (Rockwell B scale). Softer copper (below 55 HRB) will exhibit unpredictable springback behavior during bending. Harder copper (above 75 HRB) may micro-crack at tight bend radii. We reject any lot outside the specification window before a single piece enters production.
Gate 2: Post-Punching Visual and Dimensional (mid-Zone 3). After punching and shearing but before bending, the operator performs a quick visual check on every 50th piece using a go/no-go pin gauge for hole diameters and a simple surface plate for flatness. This is a 30-second check that catches dulling punch dies before they produce out-of-spec holes — a failure mode where hole diameter gradually shrinks as the punch tip wears, and if caught late, means reworking or scrapping every part produced since the last tooling change.
Gate 3: Automated Vision + Electrical (Zone 4-5, post-bending). 100% inspection of every finished busbar via vision system and HI-POT tester. This gate is the last defense before parts enter customer packaging. Data from this station is logged per serial number and stored for the duration of the OEM contract (typically 15 years for automotive, per IATF 16949 traceability requirements).
For a customer producing high-voltage DC-link busbars for an 800V EV platform, we added a Gate 2B: partial discharge testing at the bending exit, using a 5kV AC source to detect microscopic voids in the busbar insulation that would eventually lead to corona discharge and field failure. This is overkill for most applications but mandatory for any busbar operating above 600V in a sealed battery enclosure where a dielectric failure could cascade into thermal runaway.
What Ergonomics and Lean Principles Actually Matter on a Busbar Production Floor?
I have walked through factories where operators were bending 120×10mm copper bars — each weighing 8-10 kg — by hand-feeding them into machines at chest height, sixty times an hour, for an entire shift. Those operators were exhausted by lunch, and the afternoon shift’s defect rate was three times higher than the morning’s. Ergonomics is not a “nice to have.” It is a direct driver of quality and throughput.

Here are the lean manufacturing and ergonomic principles we embed into every line design:
Workstation height standardization. Every machine worktable, conveyor, and inspection surface in the cell is set at 850mm ± 20mm from the factory floor. This is the ergonomic sweet spot for operators between 160cm and 185cm in height, allowing them to slide copper bars horizontally between stations without lifting. When busbars must be lifted (e.g., from a pallet to the feed table), we specify a maximum lift weight of 12 kg per bar and install vacuum lift assists for heavier pieces.
Point-of-use tooling and consumables. Every U-cell has a shadow board mounted at eye level on the nearest pillar or wall, containing: die-change wrenches (exactly one size — the machines use unified M16 and M20 bolts across all stations), a digital caliper, go/no-go gauges for the current part number, a tube of anti-seize compound for die mounting bolts, and a cleaning brush for chip removal. Operators never leave the cell to retrieve a tool. The distance between the operator and any frequently used item is less than 3 meters.
Andon-style visual management. Above each CNC workstation, we mount a three-color stack light visible from 30 meters away. Green means running normally. Yellow means the operator has flagged a minor issue (e.g., die change in progress). Red means the station is stopped and requires supervisor attention. In a 6-station line, a supervisor can scan the floor in two seconds and know exactly where to direct their attention. The red-light trigger is also logged in the production database, and weekly Pareto analysis of stoppage causes drives continuous improvement meetings.
Line-side material presentation. Copper bars for the current production batch are presented on an angled gravity feed rack positioned at the operator’s left hand (for right-handed majority). The rack presents bars at a 15-degree angle so the operator does not need to bend at the waist to retrieve each piece — a small detail that, over 2,000 repetitions per shift, makes the difference between a healthy back and a worker’s compensation claim.
Standardized work combination tables. Every station has a laminated A3 sheet showing the documented sequence: left hand retrieves bar from feed rack (2 seconds), both hands position bar against backstop (3 seconds), foot pedal activates punch cycle (18 seconds), right hand removes bar and places on exit conveyor (2 seconds). This is the standard cycle. Operators are trained to this sequence, and deviations are addressed through coaching, not discipline. When an operator finds a better sequence, the standard is updated — the floor owns the standard.
According to the International Energy Agency (IEA) , global EV sales are projected to reach 17 million units in 2026, and each battery-electric vehicle contains an average of 5-15 kg of formed copper busbars. The manufacturing capacity required to supply this volume means that even a 5% efficiency gain per production line — the kind of gain that comes from ergonomic cell design, not from faster machines — translates into significant competitive advantage when scaled across a multi-line factory.
How Did We Design a 5,000-Unit/Day Production Line for a European Tier-1 Supplier?
In early 2025, a European Tier-1 automotive supplier approached us with a problem. They had won a contract to supply busbars for a next-generation 800V electric SUV platform — three distinct busbar part numbers per battery pack, volumes ramping from 2,000 units/day to a contractual peak of 5,000 units/day within 6 months. Their existing pilot line, built with general-purpose equipment in a traditional departmental layout, was producing 800 units/day with 17% scrap and a monthly overtime bill that their CFO was flagging as unsustainable.
Our engineering team spent two weeks on their factory floor before proposing any equipment changes. We mapped the spaghetti diagram of copper movement, timed every operator motion, and logged every stoppage cause for 10 consecutive production days. Here is what we found and how we fixed it:
Problem 1: Copper traveled 210 meters between receiving and finished goods. The raw material rack was next to the loading dock — logical for receiving, disastrous for production. The punching station was 28 meters from the rack. Shearing was 35 meters from punching. Bending was 42 meters from shearing. A single busbar took a 210-meter journey through the factory.
Solution: We consolidated all six CNC workstations into three U-cells positioned directly adjacent to a re-positioned raw material buffer zone. The copper journey dropped from 210 meters to 12 meters. Forklift traffic in the production zone dropped to near zero — bars now move by gravity conveyor and operator hand-off.
Problem 2: The three distinct part numbers (DC-link, interconnector A, interconnector B) were all processed on the same machines in a batch-and-queue pattern. Monday and Tuesday were spent running DC-link busbars. Wednesday was changeover day (4 hours lost to die changes and machine recalibration). Thursday and Friday were interconnectors. If the customer increased an order for interconnectors on Wednesday morning, production could not respond until Friday.
Solution: We dedicated Cell 1 to DC-link busbars (larger cross-section, heavier tooling, longer cycle times). Cells 2 and 3 handle both interconnector types with quick-change SMED (Single-Minute Exchange of Die) tooling setups. Changeover between interconnector A and B now takes 12 minutes — down from 4 hours. The line can respond to mix changes within the same shift.
Problem 3: Quality inspection was an end-of-line sampling bottleneck. A CMM technician would pull 5 pieces from each 500-piece lot at the end of the day. When a dimensional drift was detected, up to 500 pieces were already suspect. Twice in the three months before we arrived, entire day’s production had to be quarantined and re-inspected, delaying customer shipments by 72 hours.
Solution: We installed inline vision inspection after each bending station (Gate 3, described above) and moved CMM from end-of-line sampling to inline process monitoring with 1:200 sampling frequency. Dimensional drift is now detected within 200 pieces, not 500. The first time the vision system caught a gradual angle drift caused by hydraulic fluid temperature rise on a hot afternoon, the line supervisor adjusted the bending compensation offset and was back in spec within 15 minutes. Under the old system, that drift would have run undetected for the rest of the shift.
Results by Month 3:
| Metric | Before (Pilot Line) | After (DH CNC Design) | Improvement |
|---|---|---|---|
| Daily Output | 800 units | 5,200 units | +550% |
| Scrap Rate | 17% | 2.1% | -87% |
| Floor Space Used | 480 m² | 380 m² | -21% |
| Operator Headcount | 14 (across 2 shifts) | 8 (across 2 shifts) | -43% |
| Changeover Time | 4 hours | 12 minutes | -95% |
| Customer OTD | 78% | 99.4% | +27% |
| Monthly Overtime Cost | EUR 28,000 | EUR 1,200 | -96% |
This was not achieved by buying faster machines. The DH303-8P workstations we installed were running at the same nominal cycle times as the previous equipment. The gains came entirely from layout redesign, material flow optimization, inline quality integration, and SMED tooling practices — the things that cost thinking, not capital.
If you are planning an EV busbar production line — whether a greenfield factory or a re-layout of an existing facility — I would encourage you to contact our engineering team before you pour the concrete. We regularly consult on factory layout design with clients who have not yet committed to equipment purchases, because we have learned that a good layout with average machines consistently outperforms a bad layout with premium machines. Our custom EV busbar manufacturing solutions include complete production line design services, from spaghetti diagram analysis to capacity simulation to operator training programs.
What Are the Most Common Capacity Planning Mistakes We See?
After designing over 40 production lines for clients across 20 countries, certain failure patterns repeat. Here are the three most expensive ones and how to avoid them:
Mistake 1: Planning for average demand instead of peak demand. The OEM contract says 5,000 units/day average, so you size the line for 5,000. Then the OEM launches a new trim level, demand spikes to 7,000 for three months, and your line cannot keep up. The OEM sources the overflow from your competitor — who now has a foot in the door.
Fix: Design the line for 120% of contracted peak volume, even if you only staff it at 80% initially. The marginal cost of oversizing mechanical capacity at build time (larger copper bus, wider conveyors, a sixth instead of fifth workstation) is typically 10-15% of the total project cost. The cost of losing a customer to a competitor during a demand spike is the entire contract value.
Mistake 2: Ignoring tooling service life in capacity calculations. A punch die rated for 100,000 cycles sounds like it will last 20 working days at 5,000 units/day. But that is 100,000 cycles on new, sharp tooling. The die starts producing borderline-acceptable holes at around 70,000 cycles, and if your QC is end-of-line sampling, you may not notice until hole diameters are out of spec and parts are already packed for shipment.
Fix: Include planned tooling re-grinding intervals in your capacity model. For 5,000 units/day, factor in 2 hours of tooling maintenance every 14 working days. This reduces your effective capacity by approximately 1.5% — small enough that most planners ignore it, large enough to cause missed shipments if ignored across multiple stations.
Mistake 3: Underestimating the ramp curve. No new line hits 100% of design capacity on Day 1. Operators need time to internalize the standardized work sequence. Maintenance technicians need time to learn the failure signatures of new equipment. The material supply chain needs time to stabilize on just-in-time delivery cadence.
Fix: Model a 12-week ramp curve: Week 1 at 40% of design capacity, Week 4 at 70%, Week 8 at 90%, Week 12 at 100%. Build this into your customer delivery commitments. I have seen Tier-1 contracts lost not because the line could not eventually hit the target, but because the supplier promised 5,000 units in Week 2 and delivered 2,800. The breach of trust was harder to recover from than the breach of volume.
The LME copper price volatility we have seen throughout 2025-2026, with prices swinging between $10,000 and $13,500 per ton, makes capacity planning even more critical. When copper is at $13,500, every kilogram of scrap from an over-ambitious ramp represents a real financial hit. When copper dips to $10,000, the temptation is to overproduce and build inventory — but EV busbars are often part-number-specific to a single OEM platform, and excess inventory of a custom geometry has zero alternative buyers.
How Do 800V Architectures Change Production Line Requirements?
The shift from 400V to 800V EV architectures — a market growing from $4.28 billion in 2025 to a projected $24.41 billion by 2034 (CAGR of 21.3%) — changes several production line design parameters in ways that are not immediately obvious.
First, busbars get thicker. Higher voltage allows lower current for the same power (P = V × I), which in theory allows thinner conductors. But in practice, 800V platforms are being deployed on larger vehicles (full-size SUVs, light commercial trucks) with higher total power requirements, and the busbars connecting 800V battery modules are often 6-8mm thick copper — at the upper end of what standard tooling processes comfortably. Our DH303-8P workstations handle up to 15mm copper thickness across all three operations, but many entry-level machines top out at 10-12mm. If your line targets 800V platforms, verify your punching and shearing capacity at the full material thickness with some margin.
Second, insulation requirements become more demanding. An 800V busbar operating inside a sealed battery enclosure needs insulation that can withstand 3,000V+ dielectric testing per IEC 60664-1. This often means epoxy powder coating or PA12 nylon overmolding rather than simple PVC heat-shrink sleeving. If your line includes a post-processing insulation station (epoxy coating booth, curing oven, or overmolding press), factor this into your floor layout and cycle time calculations. The insulation process typically adds 60-180 seconds of cycle time per part, and the curing/pressing equipment requires significant floor space (40-80 m²) and ventilation infrastructure.
Third, partial discharge testing moves from optional to mandatory. At 800V and above, microscopic voids in busbar insulation become potential partial discharge sites that degrade insulation over time and can lead to catastrophic short circuits. Every production line targeting 800V EV platforms should include a partial discharge testing station — either integrated into the electrical test gate or as a standalone batch-testing station for high-voltage busbars.
For a deeper look at how EV busbar processing differs from traditional industrial applications — including insulation-safe tooling, laminated foil handling, and tight-flange U-bending — read our article on high-voltage EV busbar precision CNC bending or explore our dedicated EV busbar manufacturing solutions page.
Designing a production line is the intersection of mechanical engineering, industrial engineering, and honest capacity math. The machines are important. But the layout, the material flow, the quality gate placement, and the ergonomic consideration of the people who will stand at those stations for 8 hours a day — these are what separate a line that hits its numbers from a line that becomes a permanent headache for the plant manager. At DH CNC, we bring 20 years of busbar-specific production engineering to every line we design. If you are planning an EV busbar manufacturing facility — or reconfiguring an existing one — reach out to our engineering team for a layout consultation. We will help you get the copper flowing in the right direction before you spend a dollar on equipment.
Frequently Asked Questions (FAQs)
How do I calculate the required number of CNC machines for my EV busbar production target?
Start with your daily target volume, then work backward through takt time. For a 5,000-unit/day line producing three busbar variants per EV battery pack, you need approximately 4-6 CNC workstations depending on part complexity. Each DH303-8P 3-in-1 station processes a complete punch-shear-bend cycle in 45-90 seconds for typical EV busbars (3-8mm copper, 20-120mm width). Factor in 85% OEE (Overall Equipment Effectiveness) to account for tooling changes, maintenance, and breaks. The formula is: Required Stations = (Daily Target × Average Cycle Time in seconds) ÷ (Available Work Seconds × OEE).
What is the optimal factory floor layout for an EV busbar production cell?
A U-shaped cellular layout consistently outperforms linear layouts for EV busbar production. Raw copper enters at one leg, flows through punching, shearing, and bending stations arranged in process sequence, then exits at the adjacent leg for QC inspection. This minimizes forklift travel distance by 60-70% compared to departmental layouts and enables one-piece flow. For high-mix EV busbar production with multiple part numbers, we recommend parallel U-cells with a central tooling and die maintenance zone, allowing quick changeover without disrupting production flow.
Where should quality control stations be placed in an EV busbar production line?
QC must be integrated inline, not bolted on at the end. We recommend three inspection touchpoints: (1) incoming material inspection before copper enters the cell, verifying thickness, width, and hardness; (2) in-process vision inspection immediately after punching, catching burrs and dimensional deviations before bending adds value to a defective part; (3) end-of-line CMM or laser scanning for critical-to-quality dimensions on finished busbars. For automotive Tier-1 lines, add a fourth station: 100% electrical HI-POT testing on every busbar before packaging, as required by OEM quality agreements.
DH303-8P 3-in-1 CNC Busbar Processing Machine
Discover details, parameters, standard dies packages, and factory quotes.